
Các yêu cầu hoàn thành
The graph below shows the number of tourists visting a particular Caribbean island between 2010 and 2017.
Summaries the information by selecting and reporting the main features, and make comparisons where revelant.
Write at least 150 words.
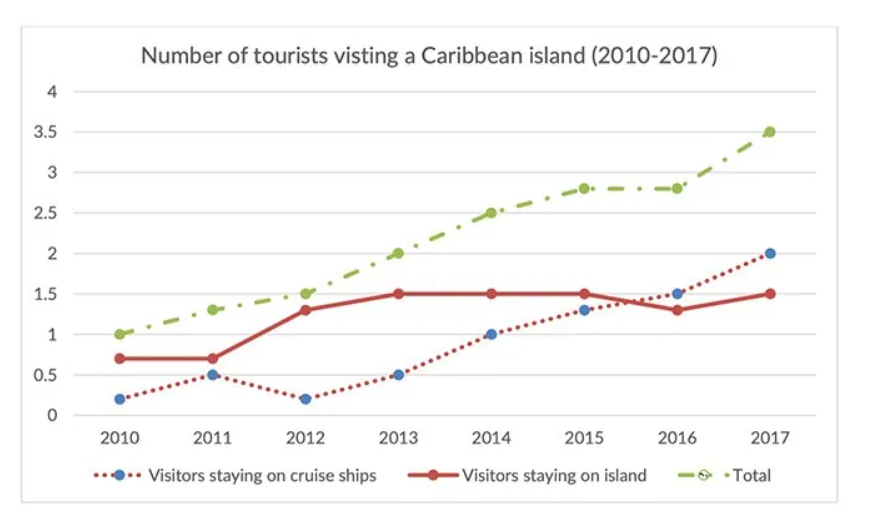
The given line graph shows the number of tourists who visited the Caribbean island from 2010 to 2017. In general, the total number of tourists in the Caribbean island increased from 1 million to 3.5 million by 2017.
As per the given information in the graph, tourists who visited Caribbean island liked to stay on the island until 2015. This number decreased to 1.2 million in 2016 but rose to 1.5 million in 2017.
Tourists who stayed on cruise ships were only 0.3 million in 2010. Although the figures improved by 2011 to 0.5 million it took a dip in 2012 and reached 0.3 million in 2013. After that, there was a steady increase in tourists on cruise ships and it increased to 2 million by 2017.
Tourists who initially liked it more on the island moved to cruise ships by 2017.
Sửa lần cuối: Thứ Tư, 26 tháng 10 2022, 9:42 AM