
Các yêu cầu hoàn thành
You should spend about 20 minutes on this task.
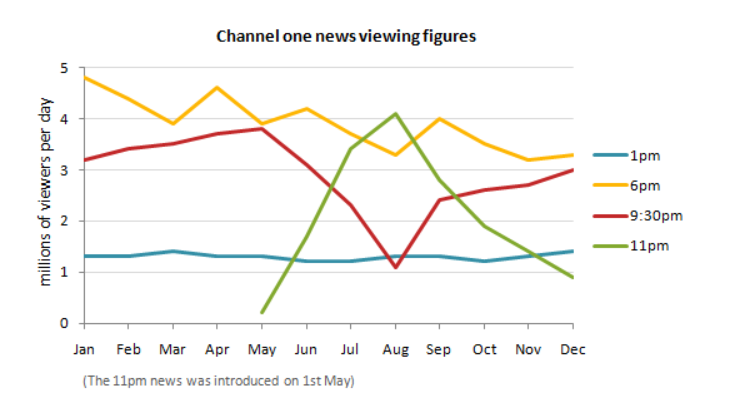
The line graph shows the channel one news viewing figures per day on one year
Summarise the information by selecting and reporting the main features, and make comparisons where relevant.
Write at least 150 words.
Model answer
The line graph compares the amount of views per day on the news channel during the year.
Overall,it is clear from the line graph that the 9:30pm news experienced notable change while the 1pm news stayed at the same level during the period of time. In particular, the 11pm news was introduced on 1st May.
In January, approximately 5 million of viewers watched 6pm news, which was the highest figure compared with about 3 million of audiences chosen 9:30 pm news. However, the amount of spectators remained stable at 1,3 million on 1pm news from January to December while the figures for 11pm news was brought on 1st May but it almost hit the bottom under 0.5 million viewers.
In August, the numbers of viewers on 11pm news increased sharply to reach the peak at 4 million, whereas the figure for 9:30 pm news decreased significantly at 1 million. The 6pm news was fluctuated during this period of time at just over 3 million viewers in December.
Sửa lần cuối: Thứ Ba, 25 tháng 10 2022, 11:40 PM