
Các yêu cầu hoàn thành
You should spend about 20 minutes on this task.
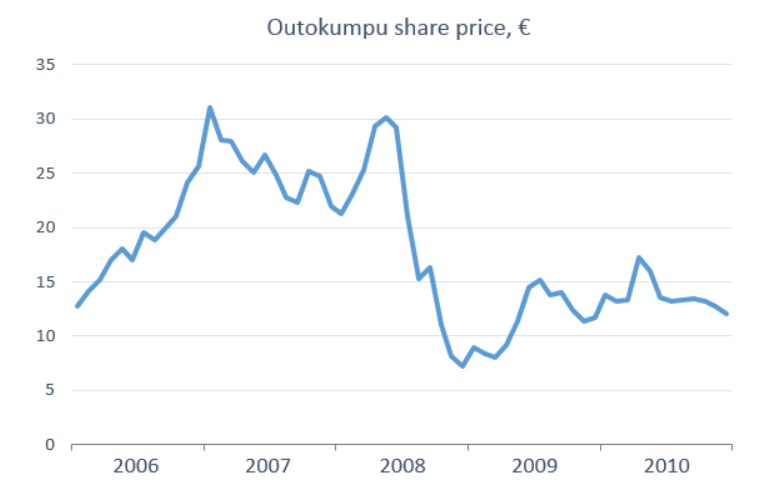
The line graph below shows the changes in the share price of Outokumpu companies in euros between January 2006 and December 2010.
Write a report for a university lecturer describing the information below.
Write at least 150 words.
Model answer
The line graph illustrates how the price shares of the Outokumpu companies behaved within specific time period, from beginning of the 2006 to the end of the 2010, in euros.
Overall, the changes on price shares experienced erratic behavior over the period.
There was a huge improvement in the shares until the middle of the 2007 followed by gradual decrease in the subsequent months. However, the price shares regained its previous level; saw sharp growth in 2008, before sinking to the lowest rate. After 2008,the shares of Outokumpu rose and fell slightly till the end of the period and reached the level, which approximately same level faced in the beginning of the period.
Generally, despite of the wild fluctuations during the 5 years, the percentage shares nearly showed the same result, 13 percent, when it is compared with initial rate. However, over the period the maximum point for the Outokumpu companies was 31 and the minimum point was about 7 percent.
Sửa lần cuối: Thứ Ba, 25 tháng 10 2022, 11:23 PM