
Các yêu cầu hoàn thành
You should spend about 20 minutes on this task.
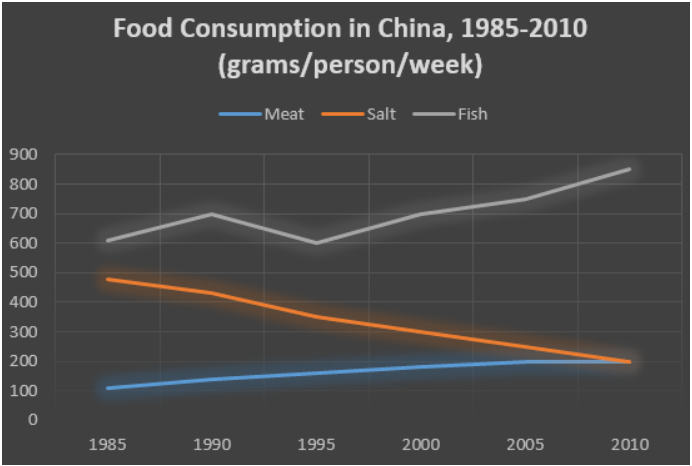
The graph below shows the changes in food consumption by Chinese people between 1985 and 2010.
Summarise the information by selecting and reporting the main features, and make comparisons where relevant.
Write at least 150 words.
Model Answer
The line graph compares changes in the amount of food consumption; meat, salt, fish in China over 25 peroid of years. It is measured in grams.
Overall, it can be seen that the consumption of fish increased, whereas the consumption of salt decreased. In addition, the consumption of meat, while a relatively low level, rose steadily during this period.
From the graph, China’s people consumed more fish than either meat or salt during this period. The consumption of fish had gradually rebound about 600 grams in 1985 and 1995. It than increased dramatically and reached peak about 850 grams in 2010.
However, there was a gradually drop in salt consumption. The number of consumed went down from almost 500 grams per person in 1985 to only 200 grams in 2010. The amount of meat consumed start about 100 grams in 1989. In contrast, this steadily rose throughout the period. By 2010, it was at the same level as the consumption of salt.
Sửa lần cuối: Thứ Ba, 25 tháng 10 2022, 11:17 PM