
Các yêu cầu hoàn thành
You should spend about 20 minutes on this task.
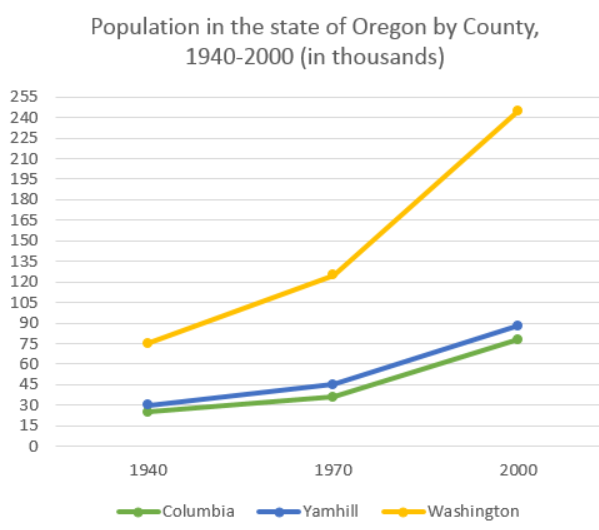
The graph below shows the population change between 1940 and 2000 in three different counties in the U.S. state of Oregon.
Summarise the information by selecting and reporting the main features, and make comparisons where relevant.
Write at least 150 words.
Model answer
The given line chart described population in the three city (Columbia, Yamhill, Washington) where belong to state of Oregon between 1940 and 2000 (in thousands). In general over six decades, Washington’s population has bigger number than Yamhil and Columbia.
Overall, the number of population for Columbia, Yamhill and Washington over six decades increased in number with high pace of growth in Washington city.
It can be shown in the graph, there was an gradual increased in Washington’s population from approximately 75 thousands people to over 120 thousand people from 1940 to 1970 then it rose dramatically almost doubled to 240 thousands by 2000.
Meanwhile there was a similar climbed pattern for Yamhill city and Columbia city. It is clear from figure both Yamhill and Columbia started at same population nearly 30 thousands by 1940 and then they climbed slowly almost 45 thousands people and over 30 thousand respectively. Furthermore, they soared significantly doubled to just over 90 thousands people for Yamhill and over 60 thousands people for Columbia.
Sửa lần cuối: Thứ Ba, 25 tháng 10 2022, 11:16 PM