
Các yêu cầu hoàn thành
You should spend about 20 minutes on this task.
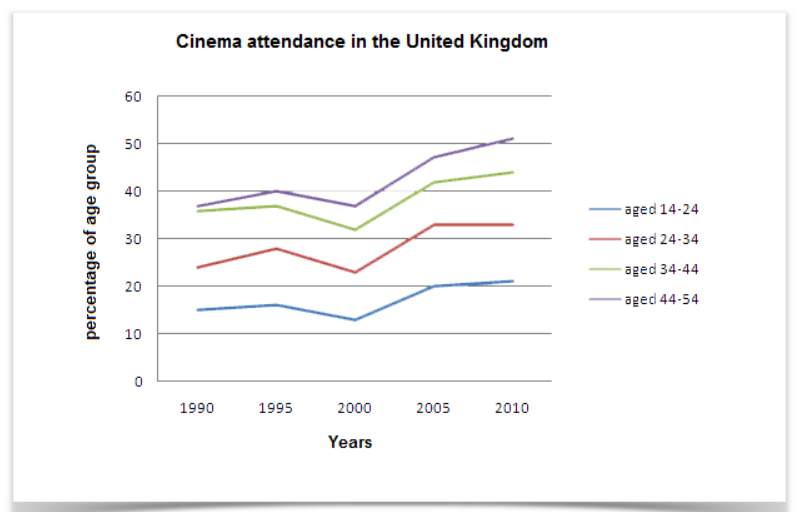
The line graph below gives information on cinema attendance in the UK.Write a report for a university lecturer describing the information given.
You should write at least 150 words
Model answer
The table line illustrated about the percentage of the report of the movies, while it was a significant between 1990 and 2010 in United Kingdom.
Ultimately, visitor cinema which was aged 44-54 was the highest position in 2010 of the report.
According to the data, the percentage of the societies who was 14-24 years old; furthermore, that of the previous aged 14-24 from 1990-to-1995 that was event increased gradually (approximately 16-18%). Moreover, in 2000, the proportion of the aged 14-24 decreased dramatically to reach 12% of the age percentage; meanwhile, that of the aged 14-24 rocketed during the end of the year.
On the other hand, the percentage of the community who were 24-34 years old, besides this, that of the aged 24-34 felt than increased gradually toward the end of the year; meanwhile, the proportion of the aged 34-44 peaked slowly to reach 36% in 1995;furthermore,that of the previous aged used to slip back to 43% in 2010. Moreover, the proportion of the aged 44-55 increased to reach 40%; moreover, that of the previous aged used to slip back from 2000 until the end of year. In the sameness, the percentage all of aged used to decrease in 2010.
Sửa lần cuối: Thứ Ba, 25 tháng 10 2022, 11:16 PM