
Các yêu cầu hoàn thành
You should spend about 20 minutes on this task.
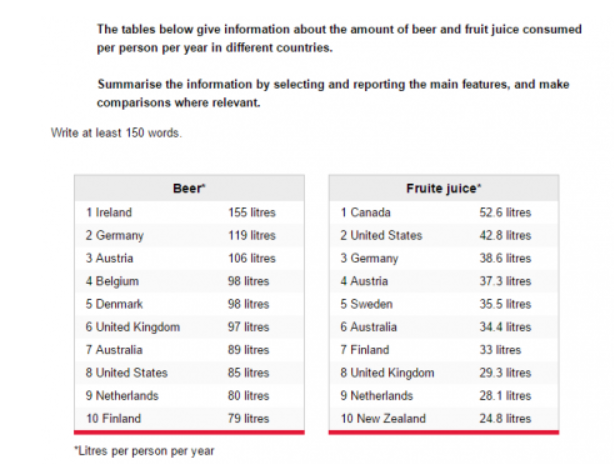
The tables below give information about the amount of beer and fruit juice consumed per person per year in different countries.
Summarise the information by selecting and reporting the main features, and make comparisons where relevant.
Write at least 150 words.
Model Answer
The tables illustrate how the average consumes of beer and fruit juice per person characterize some countries.
Beer consume, expressed in litres per person per year, showed that Ireland was the first country with more than 150 litres, followed by Germany and Austria. Apart from these nations, the remaining seven didn’t reach 100 litres threshold ranking from 98 litres in Belgium and Denmark to 79 in Finland.
Fruit juice was instead consumed mainly in Canada (52 litres), United States and Germany, with 7 countries characterized by an average of 30 litres or more. The last three countries, United Kingdom, Netherlands and New Zealand, had instead a consume between 20 and 30 litres.
The comparison between beer and fruit juice consume shows that the former was far higher than the latter. It is useful to consider,in this sense, how several countries had a consume of beer almost double than the one of fruit juice, precisely: Germany, Austria,United Kingdom, Australia and Netherlands.
Sửa lần cuối: Thứ Sáu, 21 tháng 10 2022, 2:53 PM