
Các yêu cầu hoàn thành
You should spend about 20 minutes on this task.
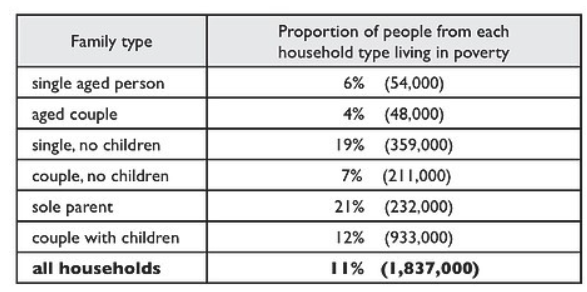
The table shows the proportion of different categories of families living in poverty in Australia in 1999.
Write a report for a university lecturer describing the information shown below. Make comparisons where relevant.
Write at least 150 words.
Model Answer
The table gives information about poverty rates among six types of household in Australia in the year 1999.
It is noticeable that levels of poverty were higher for single people than for couples, and people with children were more likely to be poor than those without. Poverty rates were considerably lower among elderly people.
Overall, 11% of Australians, or 1,837,000 people, were living in poverty in 1999. Aged people were the least likely to be poor, with poverty levels of 6% and 4% for single aged people and aged couples respectively.
Just over one fifth of single parents were living in poverty, whereas only 12% of parents living with a partner were classed as poor.The same pattern can be seen for people with no children: while 19% of single people in this group were living below the poverty line, the figure for couples was much lower, at only 7%.
Sửa lần cuối: Thứ Sáu, 21 tháng 10 2022, 2:46 PM