
Các yêu cầu hoàn thành
You should spend about 20 minutes on this task.
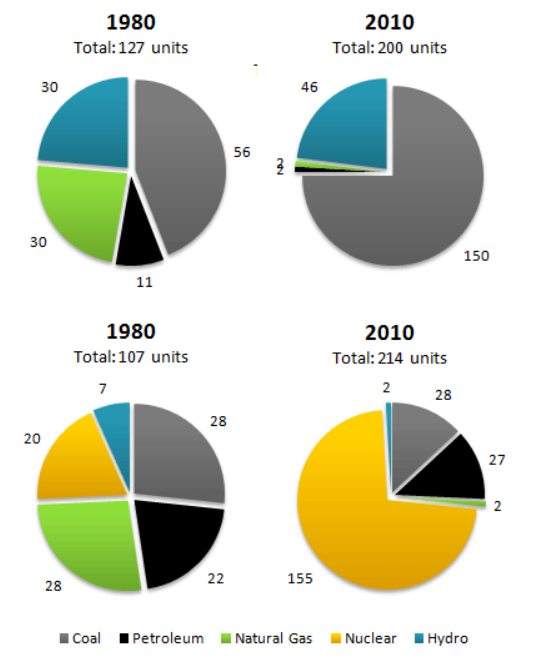
The pie charts below show electricity generation by source in New Zealand and Germany in 1980 and 2010.
Summarise the information by selecting and reporting the main features, and make comparisons where relevant.
Write at least 150 words.
Model Answer
The charts compare the sources of electricity in New Zealand and Germany in the years 1980 and 2010. Between these years, electricity generation almost doubled, rising from 127 units to 200 in New Zealand, and from 107 to 214 units in Germany.
Overall, it is clear by 2010 these two countries relied on different principal fuel sources: New Zealand relied on coal and Germany on nuclear power.
In 1980 New Zealand used coal as the main electricity source (56 units) and the remainder was produced from natural gas, hydro power (each producing 30 units) and petroleum (which produced only 11 units). By 2010, coal had become the fuel for more than 75% of electricity produced and only hydro continued to be another significant source supplying approximately 20%.
In contrast, Germany used coal as a source for only 28 units of electricity in 1980, which was matched by natural gas. The remaining 49 units were produced largely from petroleum and nuclear power, with hydro contributing only 7 units. But by 2010 nuclear power, which was not used at all in New Zealand, had developed into the main source, producing almost 75% of electricity, at 155 units, while coal and petroleum together produced only 55 units. Other sources were no longer significant.
Sửa lần cuối: Thứ Sáu, 21 tháng 10 2022, 12:57 AM