
Các yêu cầu hoàn thành
You should spend about 20 minutes on this task.
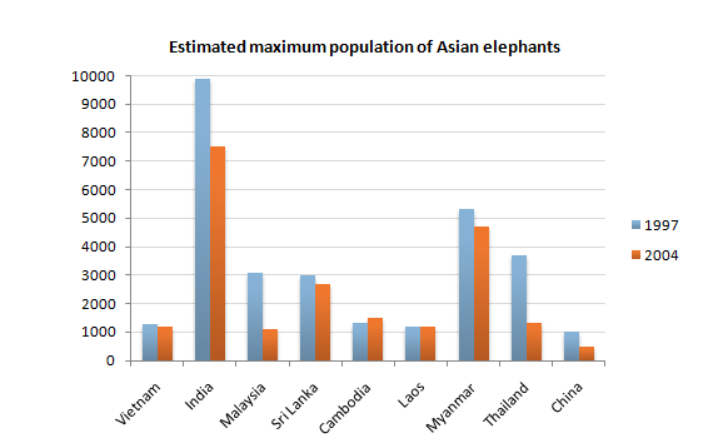
The graph below shows the changes in maximum number of Asian elephants between 1994 and 2007.
Summarise the information by selecting and reporting the main features, and make comparisons where relevant.
Write at least 150 words.
Model Answer
The graph represents the variations maximum figures of Asian elephants between 1994 and 2007.
Overall, India always took first place from the estimated population of Asian elephants in 1997 to 2004.rather than other countries.
To begin with, in both years highest figures was achieved by the India which was approximately 10000 in 1997 and 7500 in 2004 while the least value , gained by the China (below 1000 in both years). Furthermore, in 2004 all countries population of elephants was below 3000 except India and Myanmar.
In addition to that, there was a marked up decline of elephant population in India, Malaysia and Thailand in between 1997 to 2004, which was about 2000 or more. Furthermore Cambodia is singular country where the elephant population was higher than 1997. On the other hand Myanmar, China and Vietnam elephant populations were now little bit lesser than the 1997. However in that period Laos the population of Asian elephants was exactly same.
Sửa lần cuối: Thứ Sáu, 21 tháng 10 2022, 12:40 AM