
Các yêu cầu hoàn thành
You should spend about 20 minutes on this task.
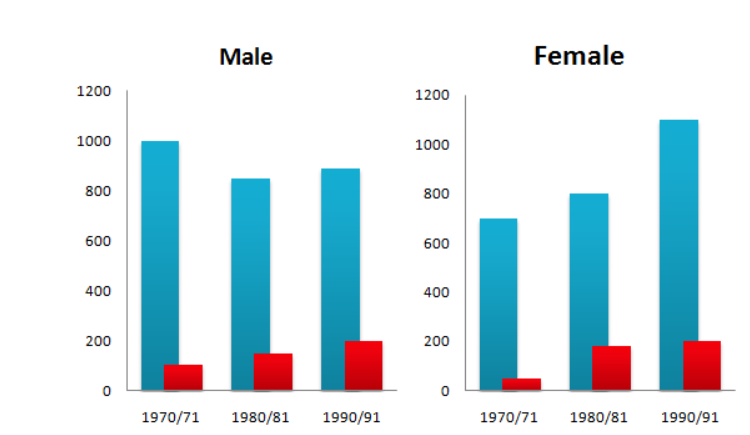
The chart below shows the number of men and women in further education in Britain in three periods and whether they were studying full time or part-time.
Summarise the information by selecting and reporting the main features, and make comparisons where relevant.
Write at least 150 words.
Model Answer
The bar chart illustrates how many males and females have studied in full-time and part-time education in the following years: 1970 to 1971, 1980 to 1981 and 1990 to 1991.
Overall, the number of women in both sectors increased significantly while it seems that the rate of men entering part-time education decreased a little and was fluctuating.
It is clear that in all three time periods more people of both sexes were involved in part-time education than fulltime. Overall the number of men in fulltime education rose from approximately 100 thousand to 200 thousand, whereas the number of men in part-time education was lower in the early nineties than twenty years earlier.
As far as women are concerned, the numbers increased in both sectors of education. The number of part-time female students increased dramatically from 700 thousand to 1.2 million in the twenty year period. The amount of women in fulltime education went up more gradually from 100 thousand in 1971 to just over 200 thousand in 1991. This was similar the increase for fulltime male students.
Sửa lần cuối: Thứ Sáu, 21 tháng 10 2022, 12:36 AM