
Các yêu cầu hoàn thành
You should spend about 20 minutes on this task.
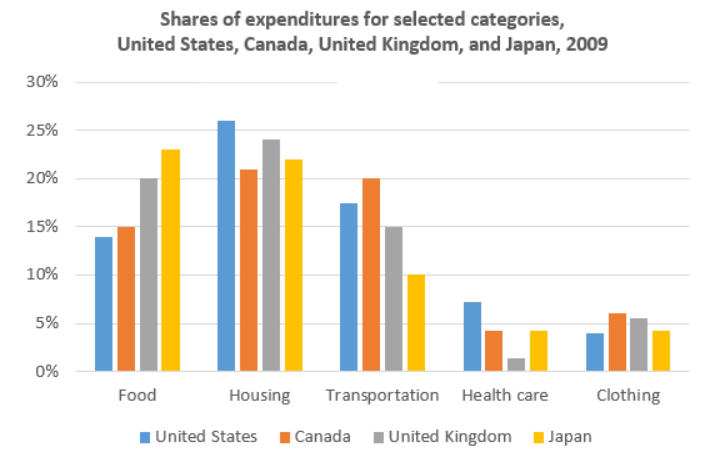
The bar chart below shows shares of expenditures for five major categories in the United States, Canada, the United Kingdom, and Japan in the year 2009.
Write a report for a university lecturer describing the information below.
Write at least 150 words.
 \
\
Model Answer
The bar chart compares the percentages of consumers spending on five different items namely food, housing, transportation, health care and clothing in the United States, Canada, United Kingdom and Japan in 2009.
Overall,it is clear that consumers in these countries spent the most money on housing, food and transportation.
In 2009, the percentage of buyers in the United States spending on housing was highest, with 26%, compared to the lower figure for the British, with 24 %. The figures of Canadian and Japanese residents were almost the same, at 21 % and 22 % respectively. In contrast, 23% of Japanese citizens spent money on food, followed by 20% of the British, 14 % Canadians and 13% of Americans. The proportions of the US
and Canada purchasers expending on transportation were higher than the figures for the others, with around 17 % and 20% respectively.
Healthcare and clothing were the least two expensive sectors. There were no significant differences in the proportions of the citizens in these nations spending on clothing, around 4 % to 6%. However, the rate of expenditure for health care in the United States was 7%, the figures for Canada and Japan citizens were the same, with 4%.
Sửa lần cuối: Thứ Sáu, 21 tháng 10 2022, 12:28 AM